Kanvic is a pioneering management consulting firm collaborating with visionary leaders on their most critical strategic issues.
Our consulting services cover four major areas: Strategy, Transformation, Marketing and Sales and Digital.
We serve clients across industries with particularly deep experience in consumer goods, retail, healthcare and industrial goods.
Explore about our latest management thinking and client success stories.
The quality of our advice comes from the diversity of our people, their commitment to success, and their passion for overcoming the toughest challenges.
We develop distinctive and adaptive strategies that help companies succeed in today's complex and uncertain world.
Our solutions are the unique product of an intensely creative, highly contextual, and deeply collaborative process.
We are building a consulting platform to produce unparalleled client impact.
We help companies succeed in India’s rapidly changing consumer market.
We develop effective strategies for an omni-channel world.
We help manufacturers gain a global competitive edge.
We help building materials companies gain a global competitive edge.
We help organisations address India’s vast healthcare gap.
Explore our latest management thinking on today’s most critical business issues.
Learn more about our client success stories through our most recent case studies.
Visualise business insights through sharp analysis and presentation
Track latest trends in business and economy in India
Talk to our experts to see how we can create impactful and long-lasting results for your business.
Find out about our offices across India and Europe
Find out how you can join us and build a firm of the future.
Get in touch with our team to learn how we can help your business or how you can start your career in consulting at Kanvic.
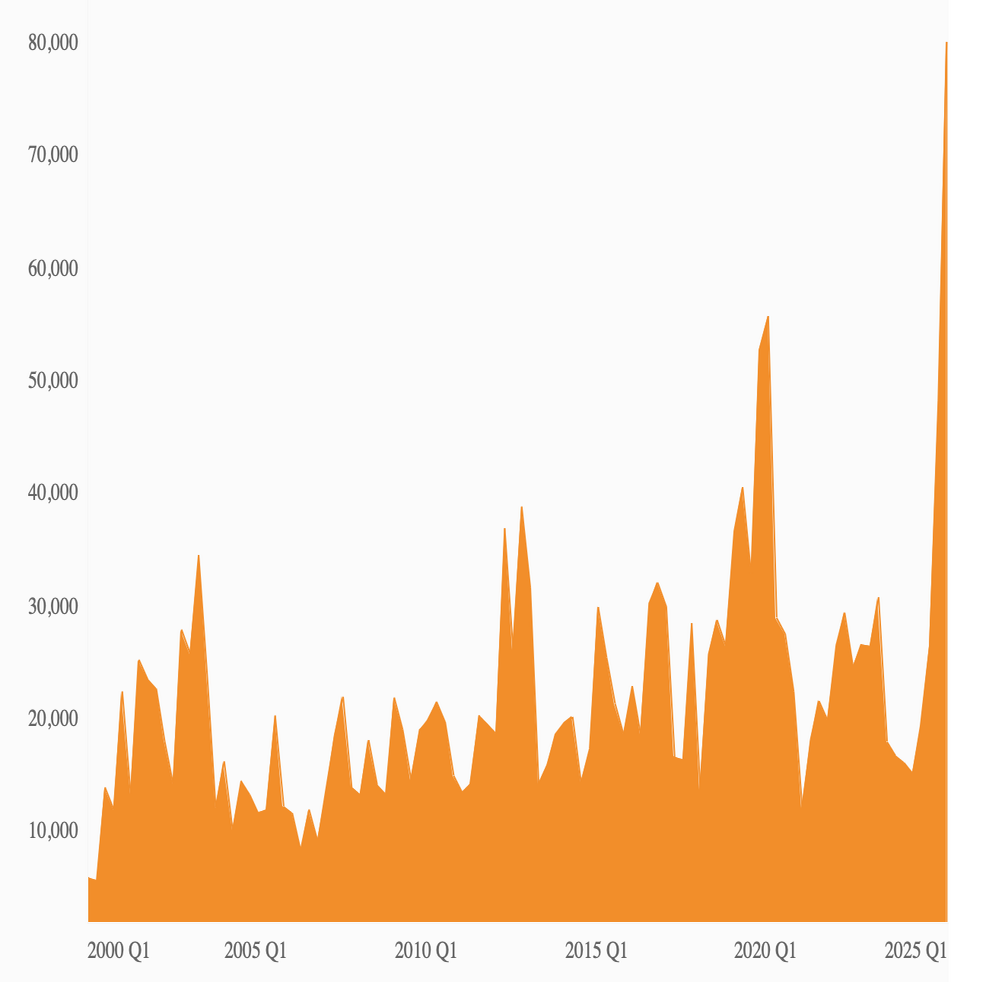
We use the power of charts to help surface insights hidden in the data.
Global uncertainty is on the rise, driven by geopolitics and trade dynamics.
India's inflation eased in November 2024, with CPI at 5.48% and IIP growth improving, while rural inflation outpaced urban rates, driven by reduced food and beverage prices.
M&A drives growth through market positioning, diversification, and digital adaptation.
India's inflation falls to 5.10% in January 2024. RBI holds the repo rate steady.
B2C growth fuels B2B e-commerce, set to reach $200 billion by 2030.
The share of digital ads rose from 24% to 36%, urging companies to enhance digital focus and maturity.